Cost Divergence Analysis: Building a Program’s Financial Case

Published
October 12, 2026

cost-divergence-analysis
Many evaluations leverage outcome data (recidivism rates, housing retention, employment gains, whatever a program is ultimately trying to move) to help communicate program successes and impact. But outcome data take time to accumulate, and even when they are available, they don't always tell stakeholders what they most want to know: does the cost of this program support its impact? Omni recently built an approach that addresses that question while evaluating the Law Enforcement Assisted Diversion (LEAD) program in Laramie County, Wyoming.
LEAD works with people at high risk of ongoing justice involvement, often driven by untreated substance use, behavioral health needs, or poverty, and connects them to case management and community services instead of routing them through the justice system. The program is built to meet people where they are, which is exactly what makes it difficult to evaluate using conventional outcomes: caseloads are small, needs vary enormously from one participant to the next, and the flexibility that makes LEAD effective also means there's no single outcome metric that captures what “success” looks like across the board.
So rather than treating outcome data as the only path to a credible answer, we built something we call the Cost Divergence Analysis: a financial comparison of what typically happens to someone with a program’s support, and what tends to happen to someone without it. For the LEAD program, using data the county already had on hand, the Cost Divergence Analysis demonstrated the program's approximate cost savings well before longitudinal outcomes were available, and gave stakeholders a clear, dollars-and-cents case for continuing the work. This methodology is valuable for clients with and without outcomes data who are looking to show another aspect of their value.
We conducted the Cost Divergence Analysis in two parallel tracks. The first track was financial: organizing LEAD’s expenditures by service type.
Laramie County provided us with a count of services delivered by type and the program’s expenditures over the same period. In simplified terms, we divided each service's total cost by the number of times that it was delivered. That gave us a per-unit proxy cost for each service type LEAD provides. Sometimes we bundled services together and assigned a single line-item cost to the bundle. “Establishing employment,” for instance, covers documentation costs, professional clothes, a phone, and the cost of rides, because these are typically part of what it actually takes to support someone in transitioning out of unemployment.
It’s important to stress that these per-unit costs are not precisely what any one participant's services cost but are rather an estimate: approximately what a housing intervention costs, approximately what a substance use referral costs, grounded in the program's real spending rather than a national average. And note that we intentionally excluded LEAD staff salaries from these per-unit figures. Contact time with participants varies too widely to average meaningfully. Some participants see LEAD staff a handful of times total; others see them several times a week for years. As a result, our per-unit costs capture direct expenses associated with delivering these services such as application fees for housing, gas costs for providing transportation, costs of clothing, etc.
The second track was building the case study itself, and it happened in three phases.
Phase 1: We began by working with LEAD staff to sketch a “typical” participant. Not a real individual, but a Representative Profile built from the patterns LEAD staff see every day: demographic characteristics, housing situation, health needs, history of justice system involvement, and enough context that a reader unfamiliar with the population can understand what those needs mean in practice.
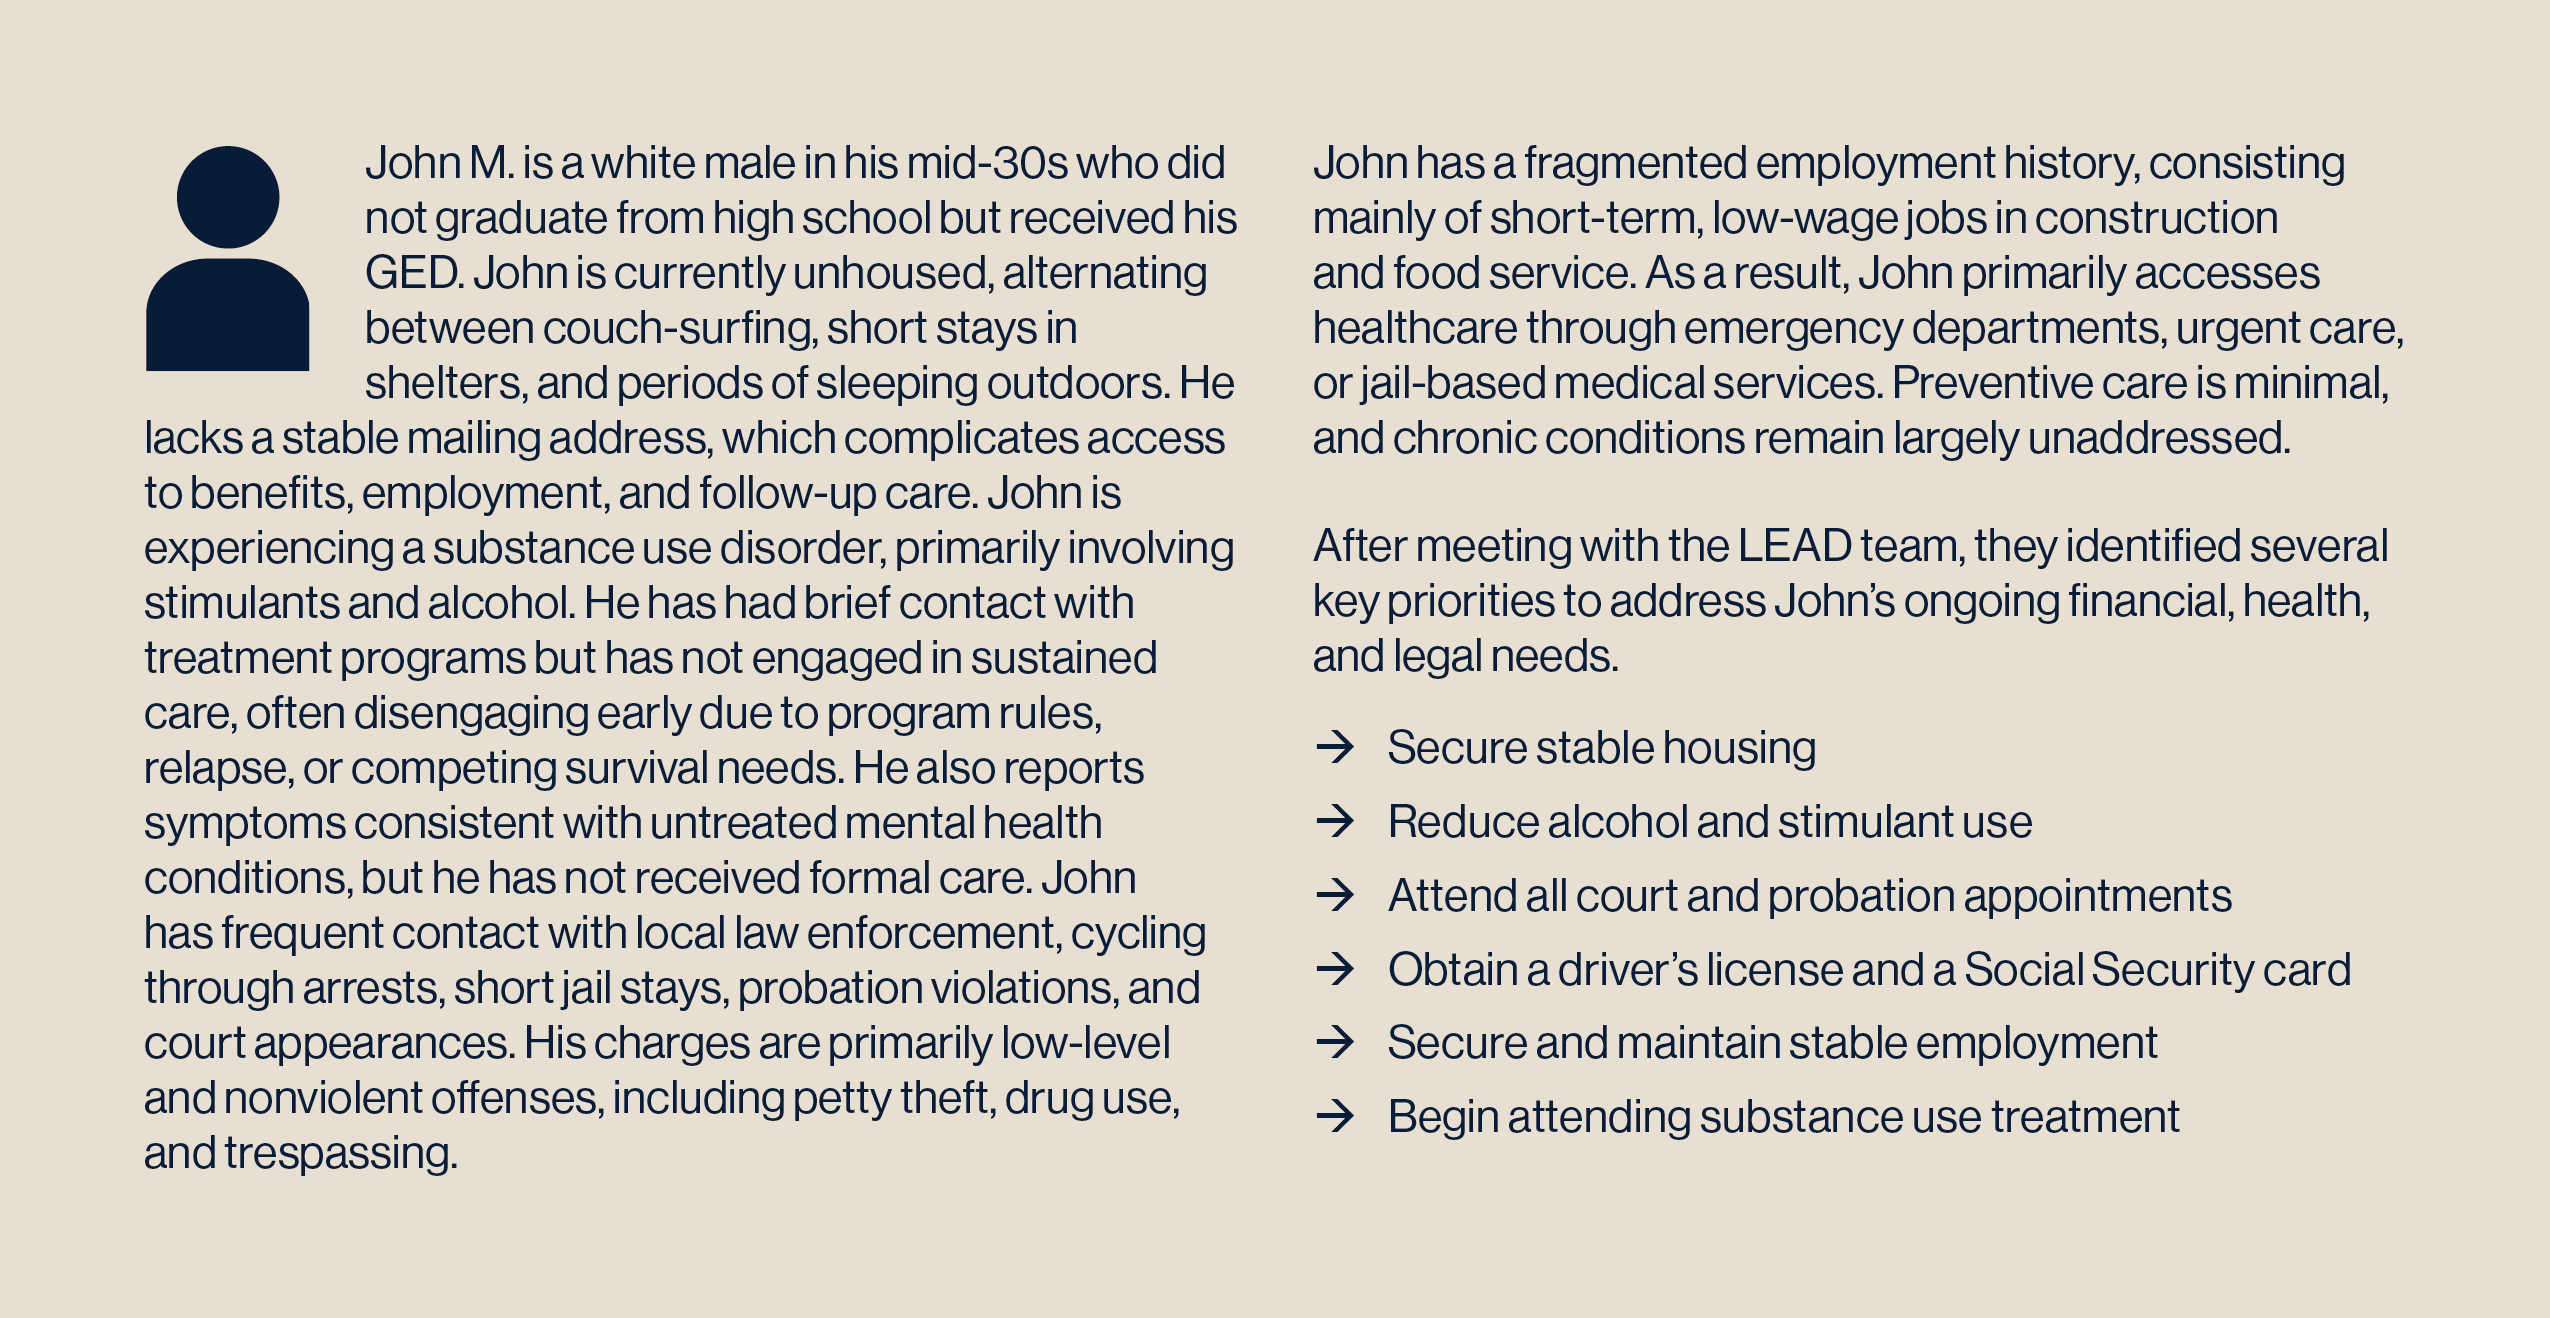
Phase 2: We mapped the services and supports LEAD would realistically provide to someone with that profile, such as rental application assistance for the housing need, counseling and prescriber access for the substance use disorder, etc.
Phase 3: We then identified the negative outcomes those services can help someone avoid (for example, substance use treatment can prevent a hospitalization, a DUI, or an overdose). We assigned these avoided outcomes a mixture of tangible costs (such as standard unemployment benefits or the nightly cost of a shelter), and intangible costs (such as the time and resulting costs incurred by law enforcement or courts working on a case). These figures provided us with an estimated cost for business as usual for an individual not receiving support from LEAD. Wherever we could, we used local and regional Wyoming data rather than national averages to more accurately reflect costs avoided.
Put together, those three phases produce a single comparison: what it costs when a program like LEAD is there to intervene, compared to the potential costs for an individual and community without support. For the Representative Profile composite participant we built for this evaluation, an investment of approximately $1,300 in LEAD, plus staff time, was associated with an estimated $26,000 in costs avoided.
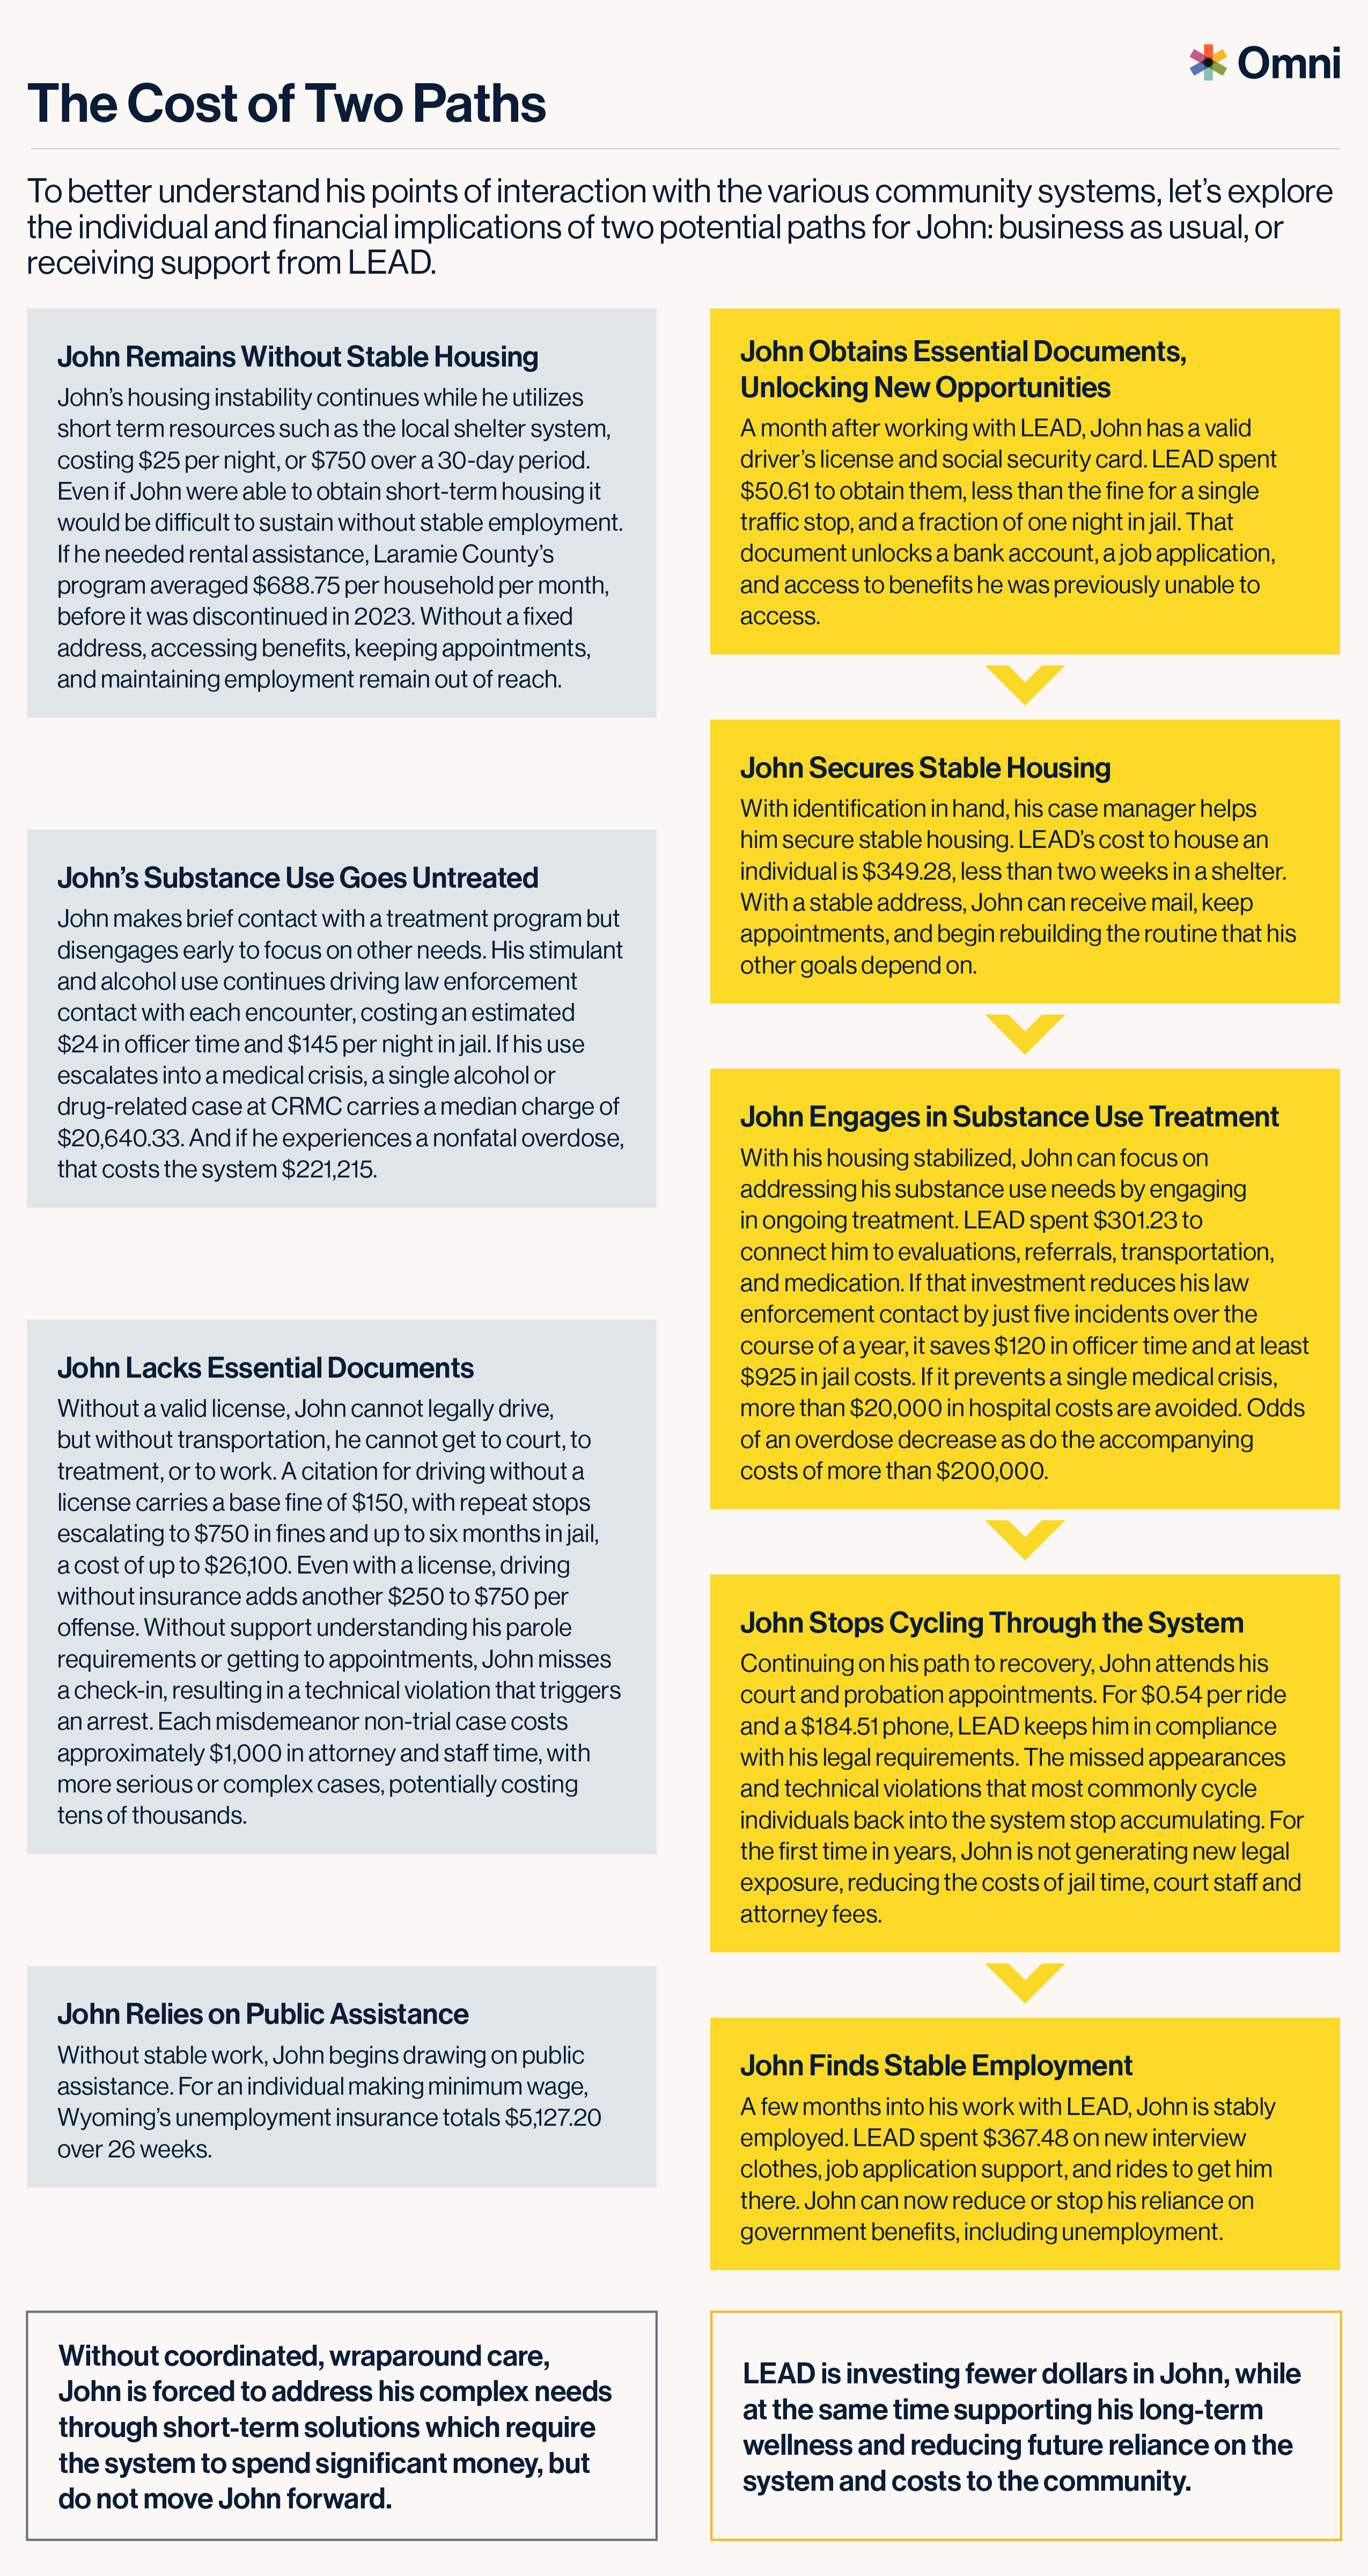
The Cost Divergence Analysis isn’t intended to replace rigorous outcome evaluation, but rather to serve as an estimate of the financial value provided by a program to either stand alone or be paired with an outcome analysis to provide a more robust view of the program’s value.
The Cost Divergence Analysis helps communicate at a glance with stakeholders who aren’t embedded in the minutiae of the program day-to-day: legislators reviewing a high-level budget line that ultimately impacts the program, a funder deciding whether to renew support, or the public that wants to hear in plain language whether a program is providing a financial benefit.
While it’s an estimate, these ballpark conclusions are helpful because they are grounded in real program spending and locally sourced cost estimates. If your program is early in its life, working with a population where consistent outcome tracking is difficult, or simply needs a way to make its case to people who struggle to delve into a 50-page report, this kind of financial narrative can help.
If you'd like to see the full evaluation behind this example, including more detail on the financial analysis, it's posted on our Laramie County LEAD Evaluation project page. And if a Cost Divergence Analysis sounds like it could assist you in making the case for your own program, reach out. We'd like to talk about what your paths look like.
Get updates on our research findings, projects, and the latest in evidence-based news to improve lives, build better systems, and drive social change.


